
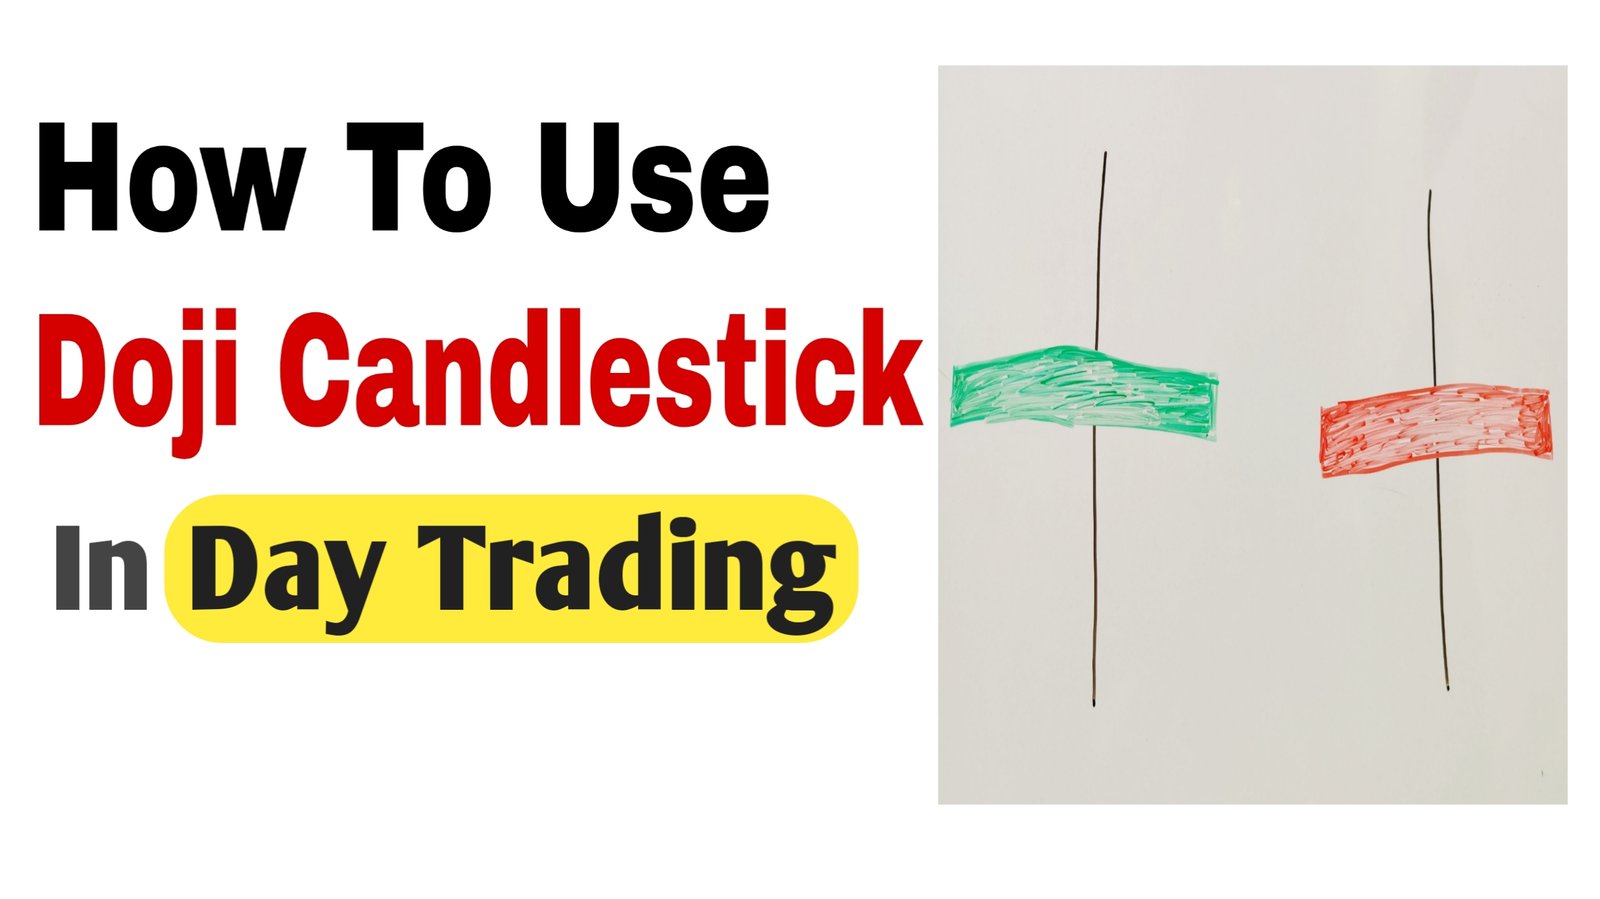
The first question that comes to mind is: What is a Doji Candlestick Pattern ?
A Doji candlestick is a chart pattern that shows the opening and closing prices are almost the same, indicating market indecision.
The next question is : What does a Doji candlestick look like ?
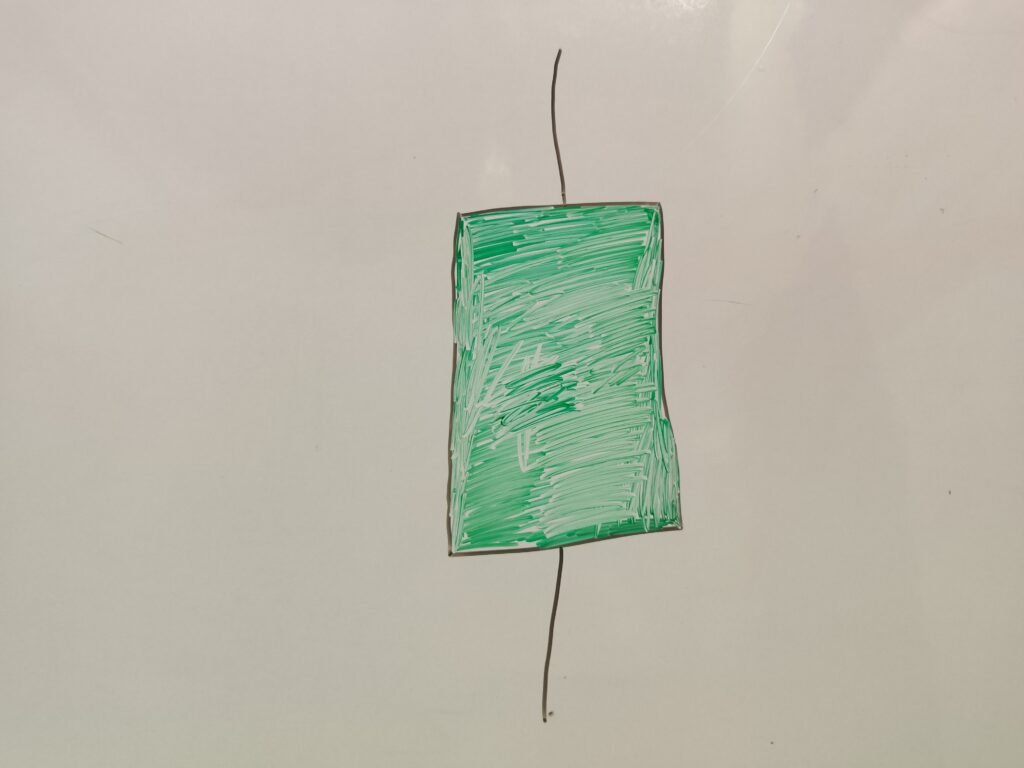
( A Regular Bullish Candlestick )
A Doji candlestick forms when the opening and closing prices are almost the same
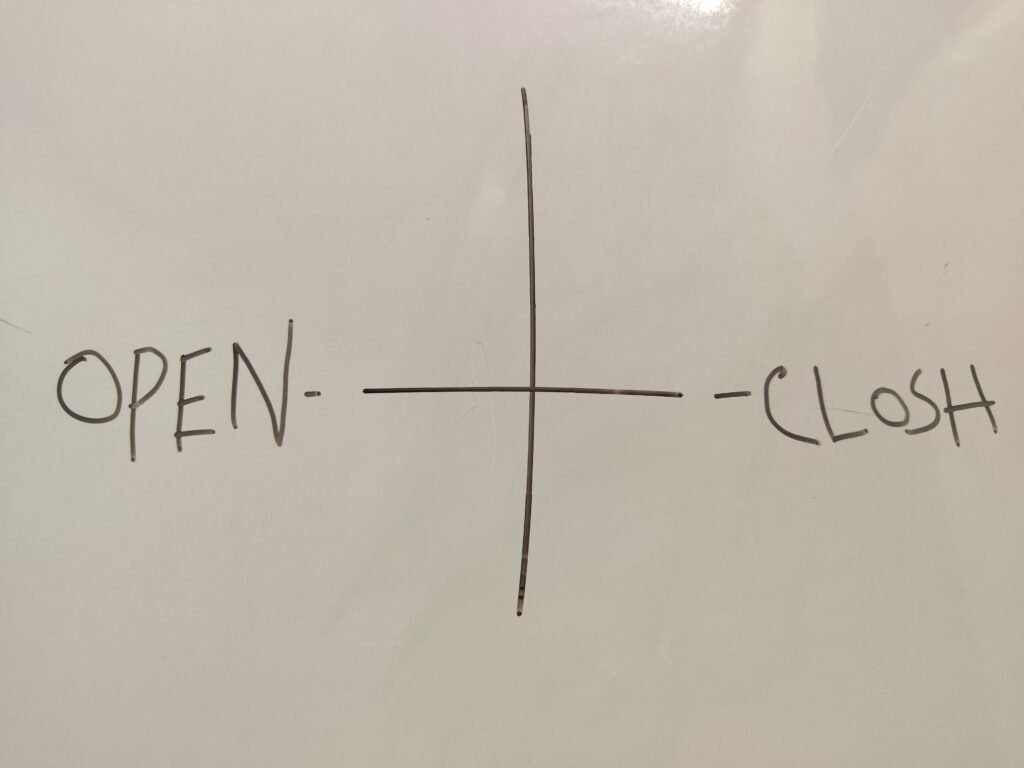
A Doji Candlestick (Open ≈ Close)
There are four main types of Doji candlestick patterns used in technical analysis. Let’s understand each one with examples
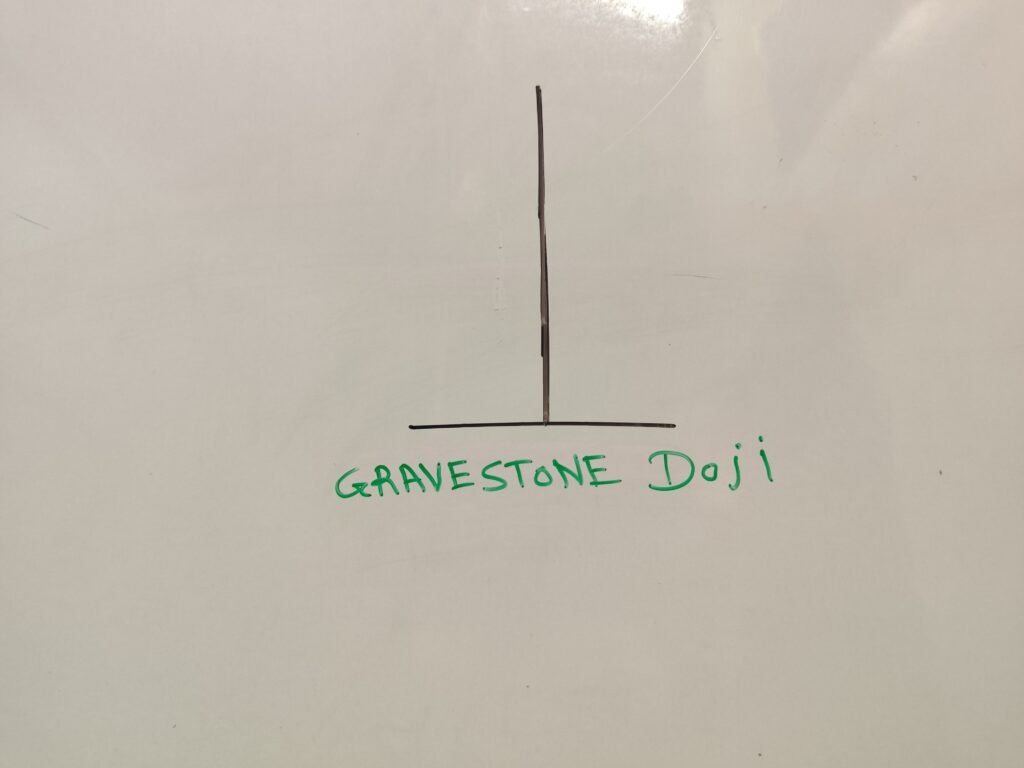
( Gravestone Doji )
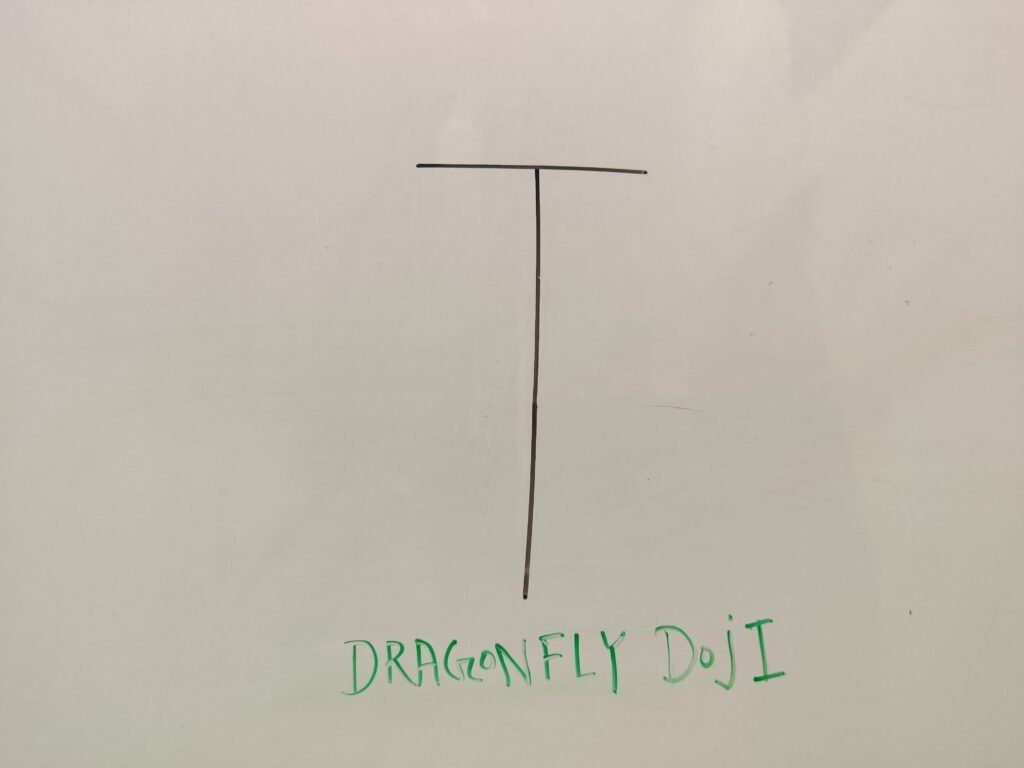
( Dragonfly Doji )
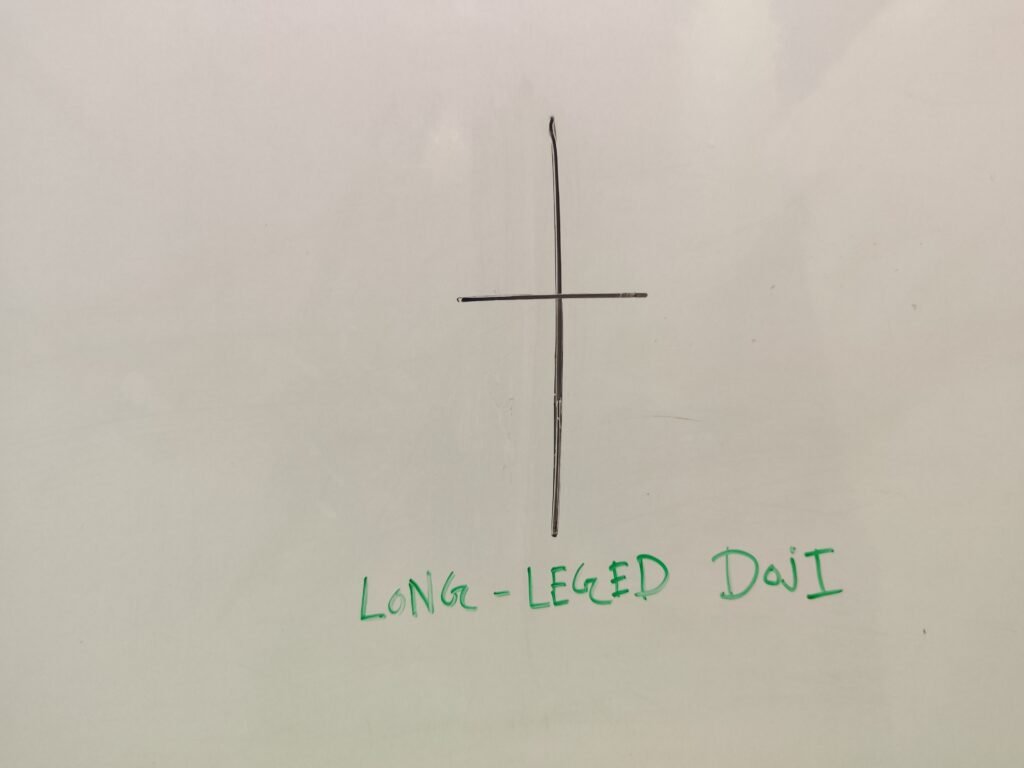
( Long Legged Doji )
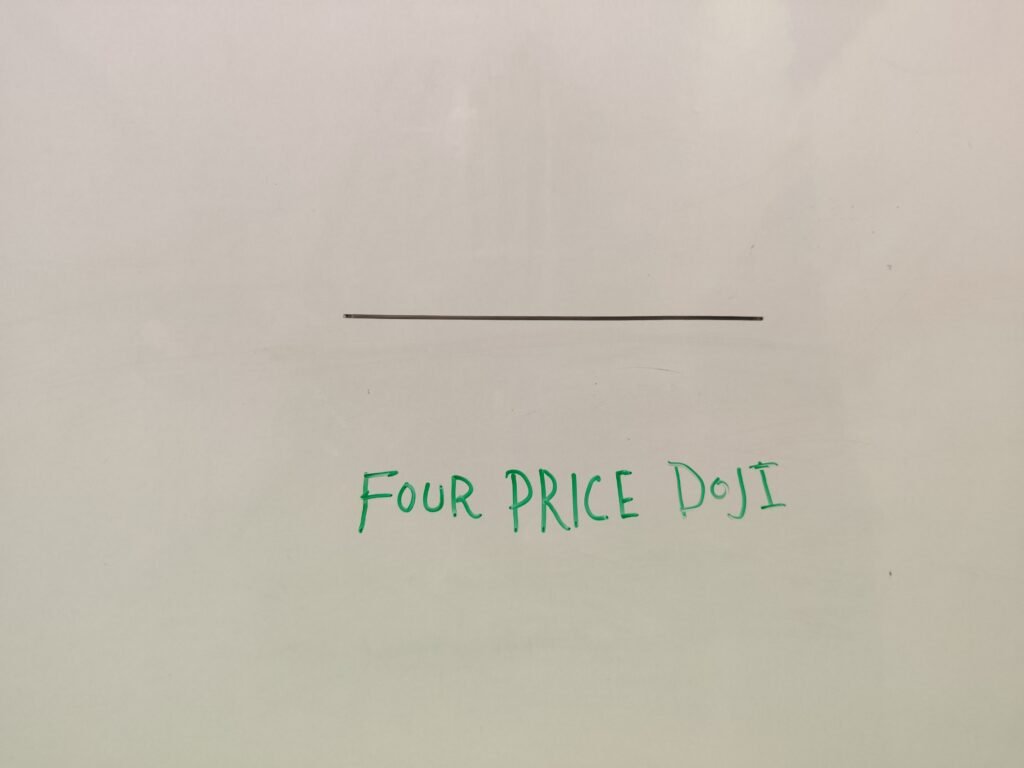
( Fore Price Doji )
Now, let’s understand each type of Doji candlestick pattern one by one.
As mentioned earlier, the opening and closing prices of a Doji candlestick are always equal or nearly equal.
As you can see, all four are exactly the same
These names may seem a little difficult at first, but as you keep learning, you’ll gradually remember them
Gravestone Doji
The buyers are done. Now the sellers take control .
Let’s understand this using a chart.
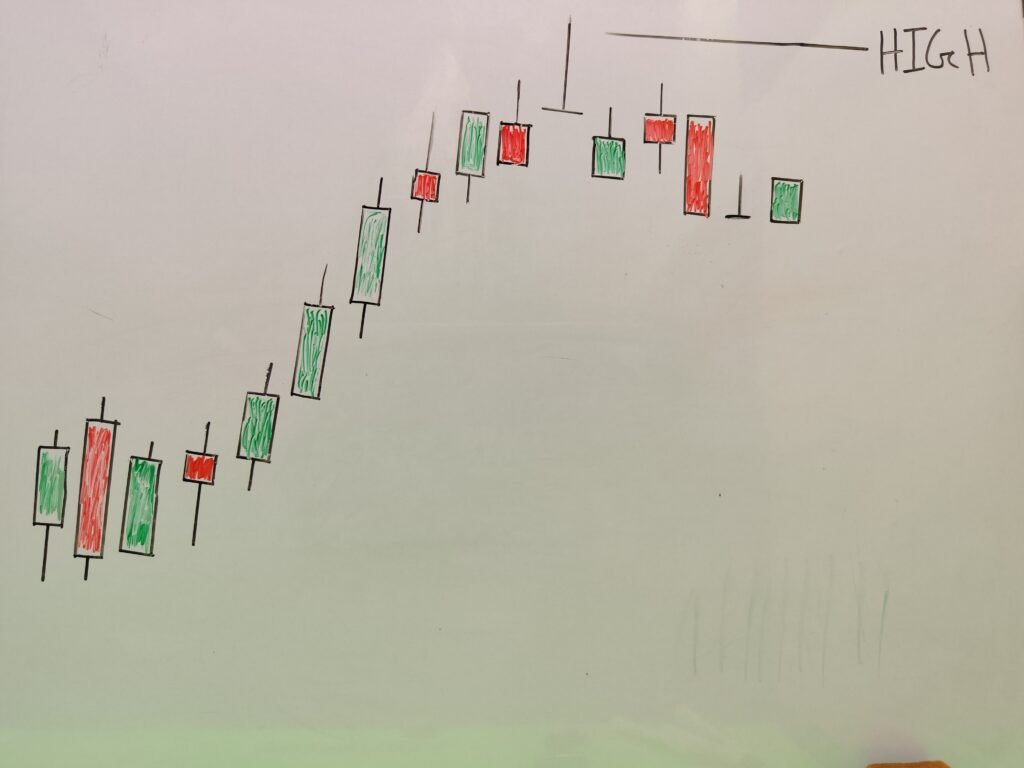
As you can see here, the Gravestone Doji has formed at the top of the chart.
Then, the next candle begins to move lower .Now, how do we enter this trade, and when is the right time to take a position ?
Now, pay close attention to the candle that forms just before the Gravestone Doji .
Wait until the price breaks below the low before entering a trade .
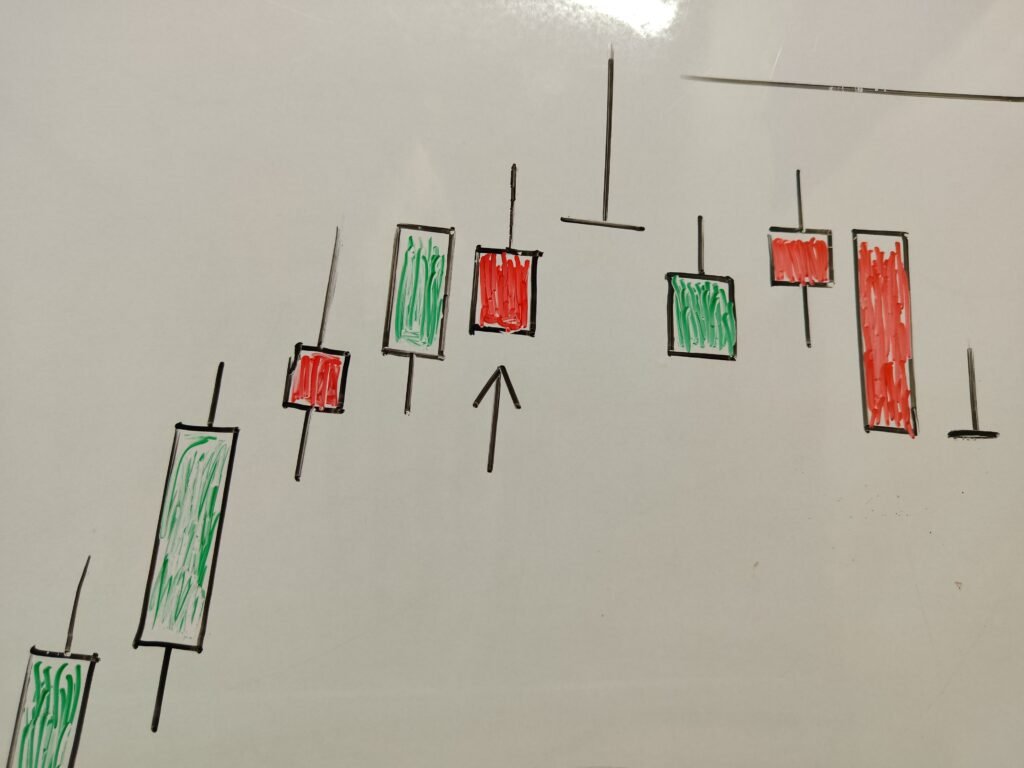
Take the trade only after the price breaks below the Gravestone Doji’s low ,
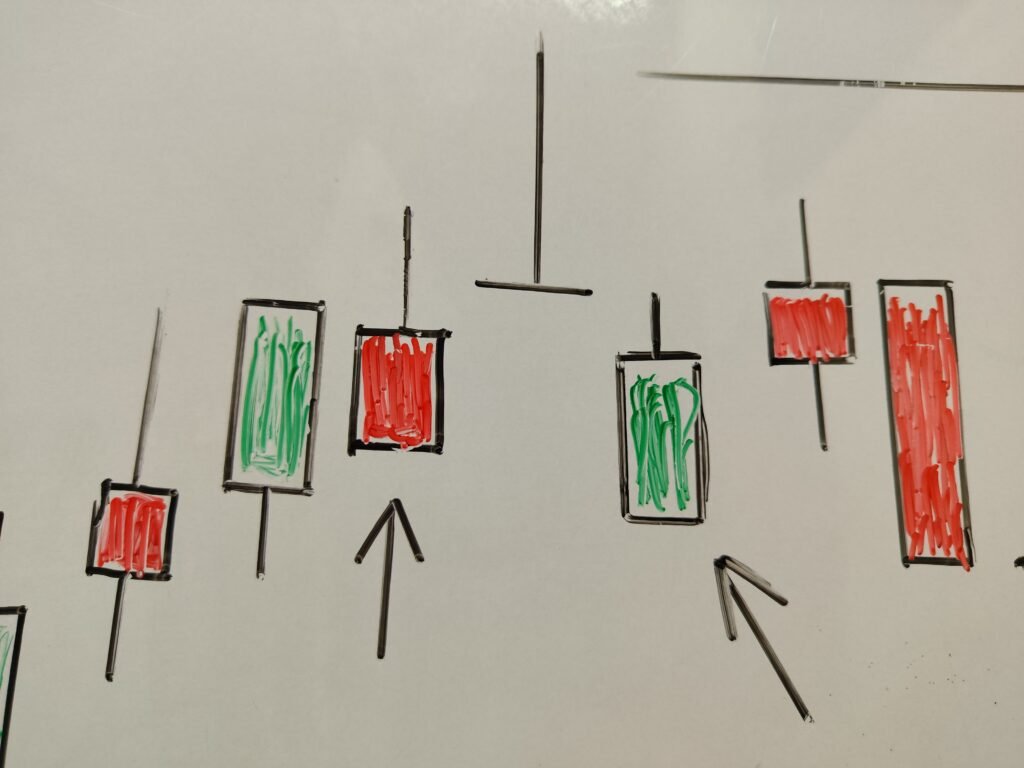
And place your stop loss just above the doji high ,
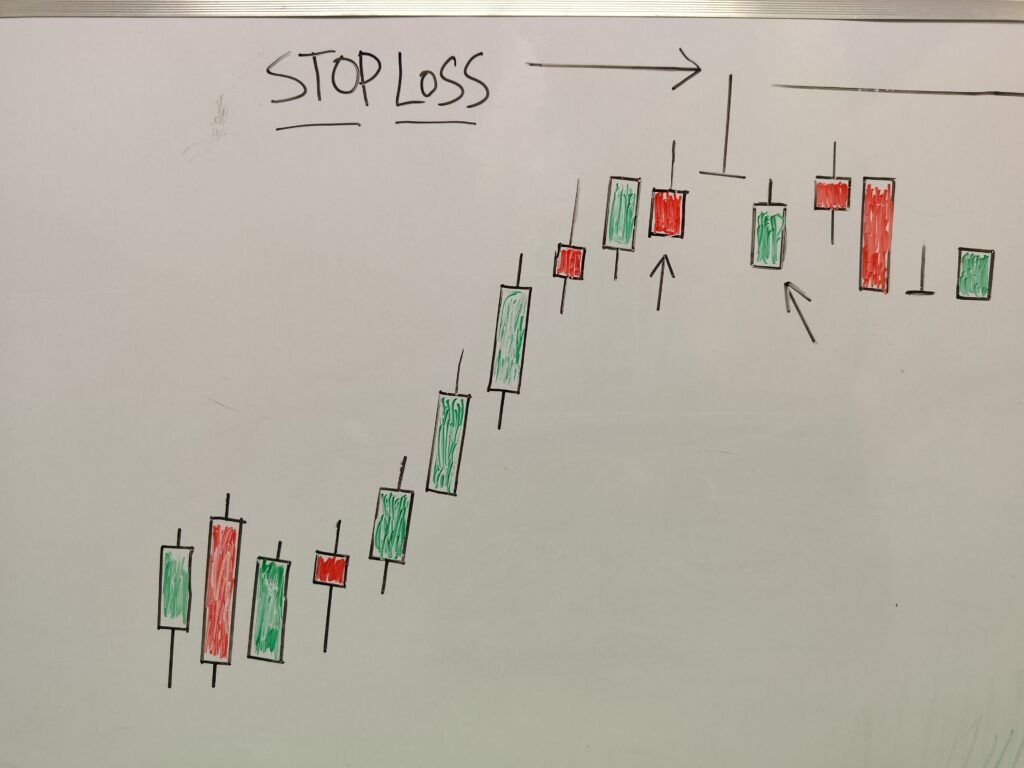
Stop loss is the most important thing in day trading .
Now, the big question is: When should you book your profit ?
It’s better to wait for a trend reversal signal before exiting the trade. That way, you can capture more profit.
D
Dragonfly Doji
This means the sellers’ move is over, and the buyers are now taking control of the market . Whenever you see this candlestick on a chart, it signals that buyers are stepping in and the market may be preparing for an upward move . This candlestick pattern is most effective for traders who focus on option buying . This candlestick pattern is especially effective for option buyers across all markets, including stocks, Forex, and crypto .
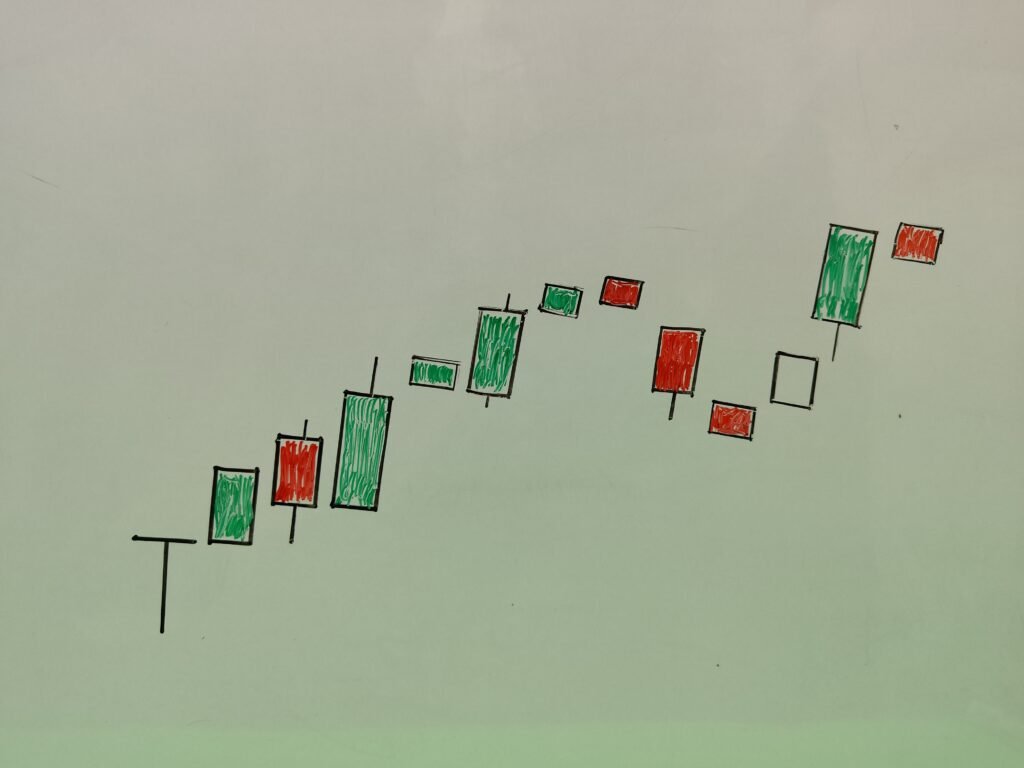
As you can see, the Doji has formed at a low, and the market is moving higher
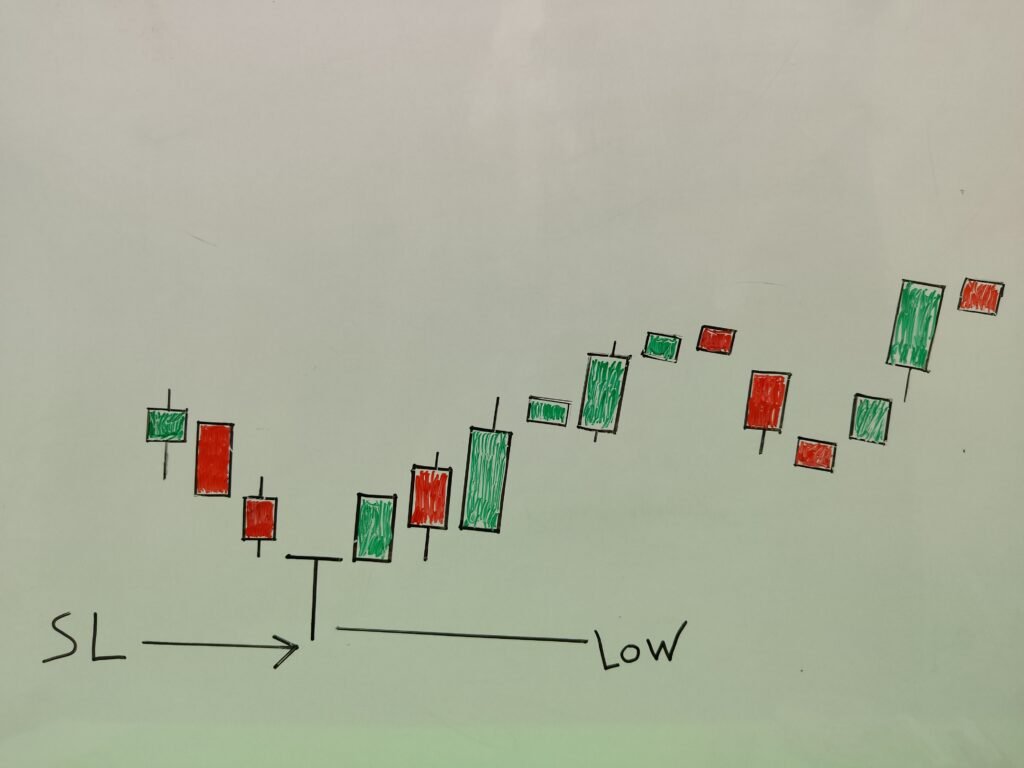
The most important part is placing your stop-loss correctly. As shown in the image, place your stop-loss exactly where I have marked it ,
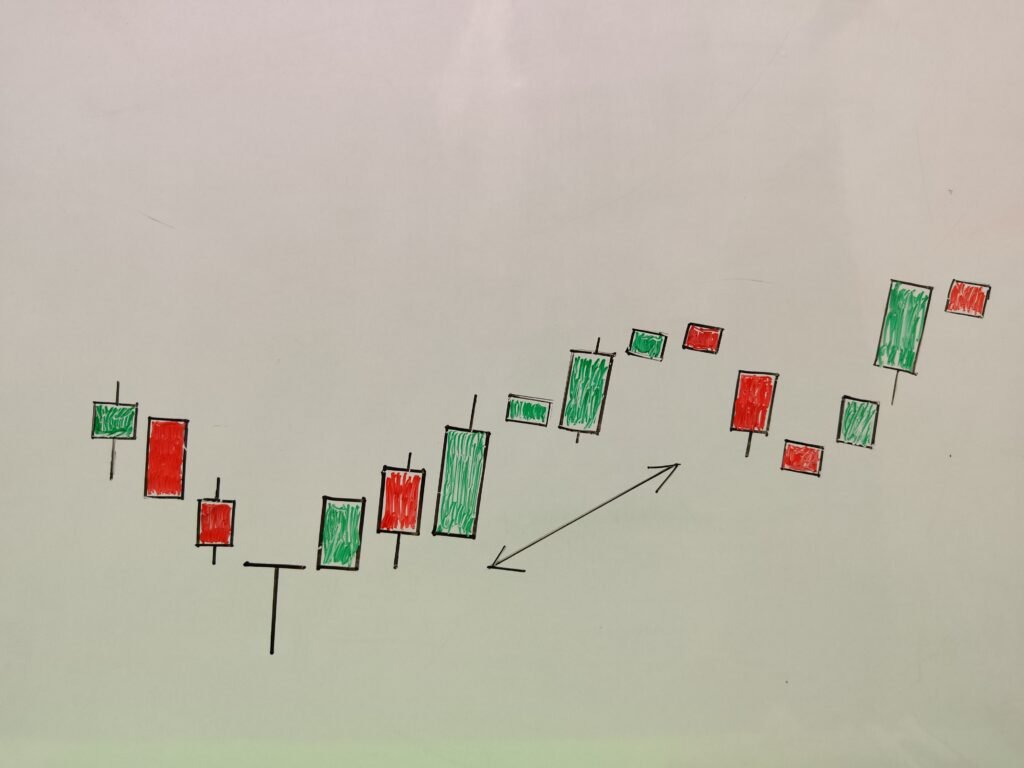
This candle works best for day traders . The best thing about this candle is that whenever it forms on the chart, the market starts moving upwards .
Long Legged Doji
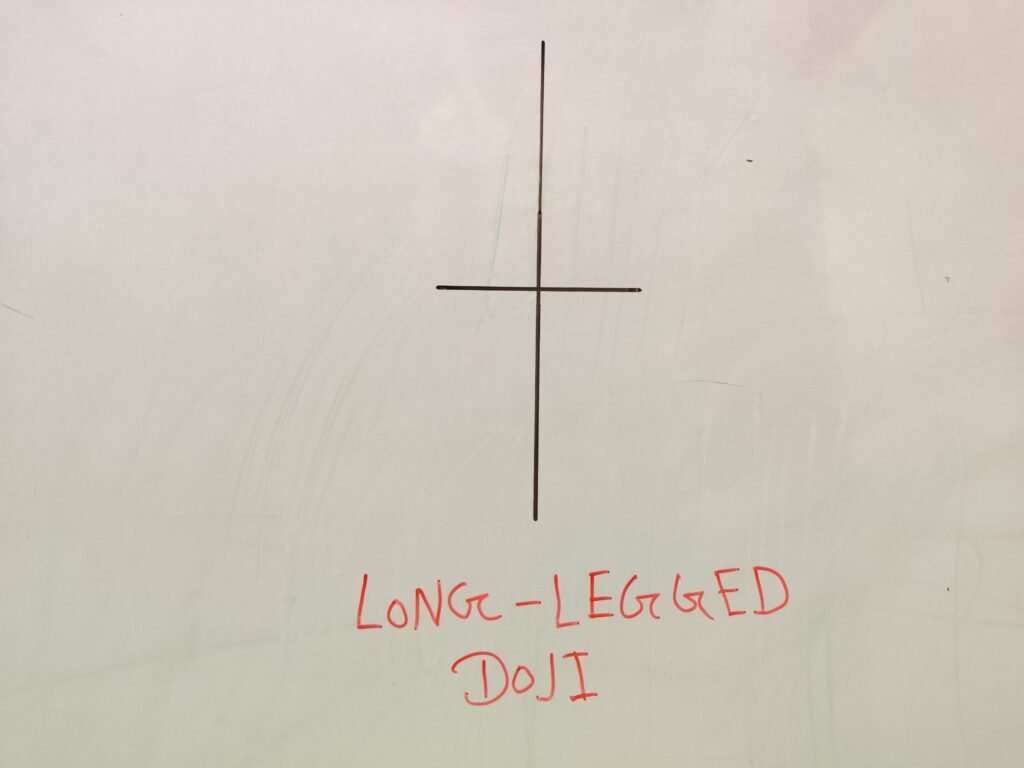
Long Legged Doji
Whenever you see a candlestick pattern like this, you should consider that the market trend may be about to change. When this type of candlestick appears, it often signals that the market could enter a sideways phase, meaning there may be no clear trend for a while.
Because of this, it is generally best to avoid taking new trades. Only experienced or professional traders should consider trading during these conditions, as sideways markets can be unpredictable.
In my opinion, if you see a sideways candle or a Long-Legged Doji, you should avoid taking unnecessary risks. If you are an intraday trader, you should understand this candlestick pattern well because it can sometimes signal that the market is about to become completely sideways.
Before entering a trade, carefully analyze the price chart over different timeframes, from the daily chart up to the weekly chart, to confirm whether the market is actually moving sideways. If the market is not sideways and a clear trend is still present, then you can consider taking a trade.
Learning to recognize these candlestick patterns is very important. From my experience, understanding them can help you become a better trader over time. I have studied these candlesticks since I first started trading, and they have become an important part of my trading strategy.
Four Price Doji
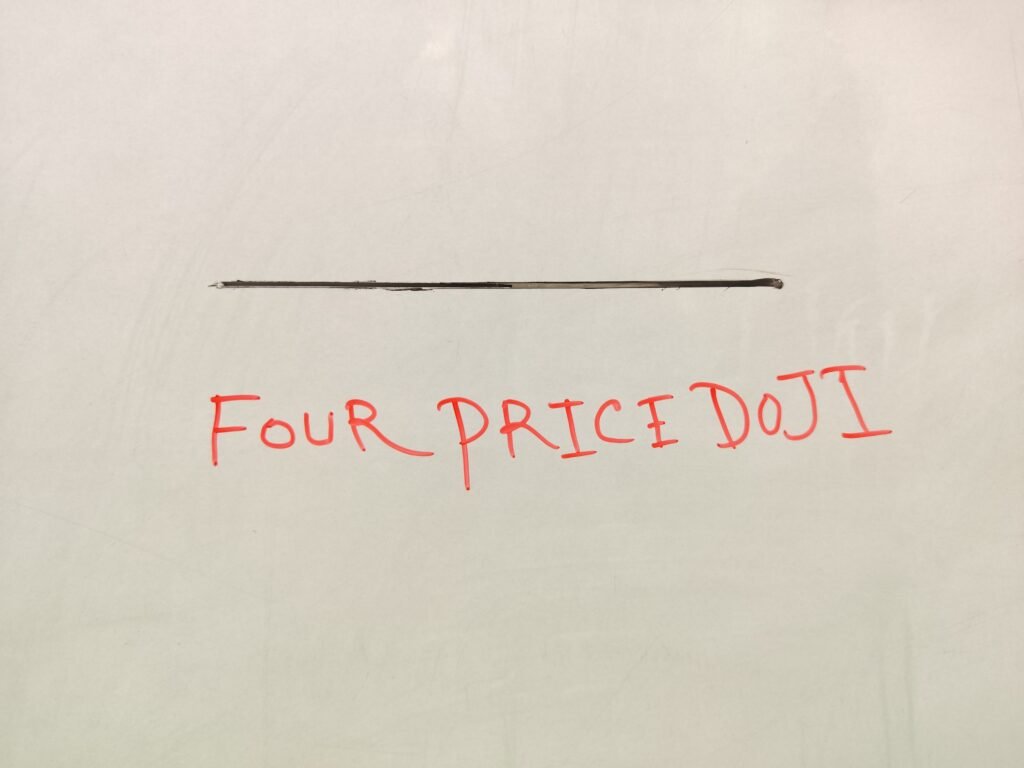
Look, it looks exactly like a minus sign. This candle has no real significance. This candlestick doesn’t indicate that the market will move up or down. If you see it, don’t be worried. It has no impact on the market and doesn’t change anything.
I’ve told you everything I know about the Doji candlestick.
If you still have any questions, please let me know in the comments below.